





Hotel performance is best evaluated using a combination of financial, operational, guest experience, and long-term business metrics rather than relying on a single KPI.
Key Takeaways
-
Traditional hotel KPIs such as occupancy, ADR, RevPAR, and profitability remain essential, but they only measure part of a hotel’s performance.
-
A comprehensive hotel evaluation should also consider operational efficiency, guest satisfaction, service quality, innovation, safety, and brand reputation.
-
Using a broader set of hotel performance metrics helps leaders identify weaknesses, benchmark progress, and make better strategic decisions.
Hotel performance is easier to measure than it is to understand. Occupancy percentages, profit indicators, and return on investment are traditional performance measures that many hoteliers rely on to evaluate how well their properties are doing.
Taken in isolation, however, they are now thought to provide misleading signals and fail to adequately support the needs of today's organizations.
Capturing the full picture requires zooming out. Does your hotel genuinely take safety seriously? Does it embrace innovation? Are you delivering service excellence consistently enough that guests seek you out for that reason alone?
A broader view of the role your hotel plays in the hospitality business yields a more representative impression of its performance.
This article sets out the 6 dimensions that together determine how well a hotel is truly performing and the key metrics that bring each one into focus. Let's start with the most important one.
Financial Performance

It goes without saying that, like any other commercial business, hotels are primarily profit-driven enterprises. This requirement sees hotels pursue strategic management accounting techniques, such as cost optimization, value chain analysis and benchmarking.
In doing so, they may choose between a market-orientation or sales-orientation business strategy to optimize their financial outcomes.
Equally, they may opt for a more traditional rooms-revenue model or lean towards a total revenue management approach, while the IT-savvy may seek to future-proof their business by incorporating data science into their revenue management.
Various key performance indicators (KPIs) can be used to assess a hotel's financial performance. Is the business recording a solid return on its investments (ROI)? Are hotel operations as efficient as they could be?
The metrics below represent the financial instruments most relevant to answering those questions, spanning profitability, cost control, and the efficiency with which revenue converts into sustainable returns.
Gross Operating Profit (GOP)
While GOPPAR normalizes profitability against room inventory, GOP provides the absolute figure (total revenue minus total operating expenses) that investors and ownership groups tend to focus on first.
It cuts through per-room normalizations to show what the property is actually delivering financially and whether the cost structure supporting that revenue is sustainable over time. A hotel can present an impressive RevPAR and still carry a GOP that signals structural inefficiency. 
Tracking GOP on a monthly and quarterly basis allows management to identify whether rising revenues are being offset by cost escalation and to intervene before margin erosion becomes a longer-term pattern.
EBITDAR
EBITDAR, or earnings before interest, taxes, depreciation, amortization, and rent, is the metric most commonly used in hotel investment and ownership conversations. By stripping out financing costs and lease obligations, it isolates the operational earning power of a property independent of how it is structured or financed.
This makes it particularly useful when comparing performance across properties with different ownership arrangements or when presenting a hotel's financial health to prospective investors.

For hotel operators working within management or lease agreements, EBITDAR provides a cleaner view of underlying performance than metrics that carry the weight of capital structure decisions.
Gross Operating Profit Per Available Room (GOPPAR)

GOPPAR is one of the most revealing profitability metrics available to hoteliers because it introduces operating costs into the performance equation.
Calculated by dividing gross operating profit by the total number of available rooms, it shows how much profit each room is actually generating after expenses are factored in.
A property can post strong revenue figures and still carry a weak GOPPAR if costs are poorly controlled, which makes it a more honest measure of operational efficiency than revenue-only metrics.  Where RevPAR tells you how well you are filling rooms at a given rate, GOPPAR tells you whether any of that revenue is actually reaching the bottom line. For owners and asset managers reviewing financial performance, it is often the number that matters most.
Flow-Through Rate
Flow-through rate measures how effectively incremental revenue converts into profit after variable expenses are accounted for. It is calculated by dividing the change in gross operating profit by the change in total revenue over the same period.
A high flow-through rate indicates that the hotel is managing variable costs well as revenue grows: a result during periods of demand uplift. A low rate, conversely, points to expenses rising in step with or faster than revenue, which erodes the value of any top-line gains. 
This metric is particularly instructive during peak trading periods, when management teams can assess whether improved occupancy and rate performance is actually translating into proportionally stronger profitability.
Cost Per Occupied Room (CPOR)
CPOR measures the average cost of servicing a single occupied room, covering housekeeping, amenities, utilities, and related operational expenses. It is calculated by dividing total room-related operating costs by the number of rooms sold.
Tracking CPOR over time allows operators to identify cost drivers at a granular level and assess whether efficiency initiatives, revised housekeeping schedules, energy-saving measures, and procurement adjustments are producing measurable results. 
A declining CPOR trend is a reliable indicator that operational efficiency is improving. When combined with ADR and occupancy data, it also helps management determine the minimum rate thresholds at which a room becomes genuinely profitable to sell.
Sales Performance

Finance is a broad topic influenced by a whole host of subset factors, and chief among these is sales performance. Whether a hotel's sales skyrocket or dwindle depends on a multitude of variables.
Some are within the hotel's control: its marketing activities. Is it leveraging its online potential effectively? Or the extent to which it is succeeding in tailoring its offerings to specific guest segments.
Other more environmental or market-driven factors are considerably harder to manage, and what sets successful hotels apart is how they choose to react when conditions shift.
The metrics below cover the core instruments used to evaluate sales performance, from headline revenue indicators down to the booking behaviors that shape long-term channel economics. Read together, they offer a more complete picture of how effectively a hotel is converting its inventory and rate strategy into actual revenue.
Occupancy Rate
Occupancy rate measures the proportion of available rooms sold during a given period, making it one of the most direct indicators of market demand and distribution effectiveness. It is calculated by dividing the number of rooms sold by the total number of rooms available.
While a high occupancy rate signals strong guest interest and effective sales strategies, it should never be read in isolation—a property running at 95% occupancy on heavily discounted rates may be in a weaker financial position than one running at 75% with disciplined pricing. 
Segmenting occupancy data by room type, booking channel, and guest segment adds a further layer of insight, revealing where demand is strongest and where promotional or distribution adjustments may be warranted.
Average Daily Rate (ADR)
ADR answers a straightforward question: What is the average price a guest is paying for a room? Calculated by dividing total room revenue by the number of rooms sold, it sits at the center of any pricing strategy evaluation and helps management determine whether rate positioning is aligned with demand conditions and competitive benchmarks.
A stagnant or declining ADR can signal underpricing, an overreliance on discounting, or a shift in the guest mix toward more price-sensitive segments. 
ADR is most useful when tracked alongside occupancy and RevPAR rather than independently. A high ADR paired with weak occupancy may indicate the hotel has priced itself out of its market, while a modest ADR with strong occupancy could still yield healthier total revenue depending on cost structure.
Revenue Per Available Room (RevPAR)
RevPAR is the most widely referenced finance-oriented hotel KPI because it combines both pricing and occupancy into a single measure of revenue efficiency. It can be calculated either by multiplying ADR by the occupancy rate or by dividing total room revenue by the number of available rooms.
A rising RevPAR alongside flat occupancy suggests the pricing strategy is working; a falling RevPAR despite high occupancy is typically a sign of excessive discounting that undermines rate integrity. 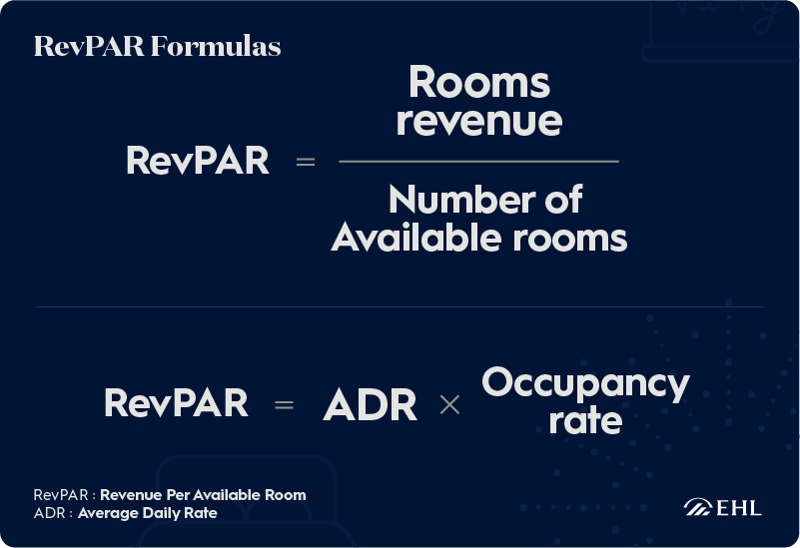
In board-level and investor conversations, RevPAR is often the first number on the table precisely because it communicates so much in a single figure, though it remains a revenue measure, not a profitability one, and should be read alongside GOPPAR for a complete financial picture.
Total Revenue Per Available Room (TRevPAR)

TRevPAR expands the RevPAR framework to include all revenue streams including f&b, spa, events, parking, and any other ancillary income, divided by total available rooms.
For full-service and resort properties, this is often a more relevant top-line measure than RevPAR alone, since it captures how effectively the entire property is being monetized rather than just the room inventory.
A healthy TRevPAR relative to RevPAR indicates that ancillary departments are contributing meaningfully to overall performance.
Tracking TRevPAR by department over time helps management identify which revenue streams are gaining or losing traction and where investment in service offerings or upselling capability is most likely to generate returns.
Average Length of Stay (ALOS)
ALOS measures the average number of nights per booking and carries direct implications for both revenue stability and operational efficiency. Longer stays reduce room turnover frequency, lower the labor costs associated with cleaning and rebooking, and contribute to more predictable demand forecasting.
It is calculated by dividing total occupied room nights by the number of individual bookings, and the result shapes how management approaches everything from minimum stay requirements to promotional package design.
Hotels targeting business travelers typically see a shorter ALOS than leisure-focused properties, and understanding this dynamic helps management tailor rate strategies accordingly—offering extended-stay incentives where the economics support it, or adjusting minimum-stay restrictions during high-demand periods to protect yield.
Direct Booking Ratio
The direct booking ratio measures the proportion of reservations made through a hotel's own channels (website, phone, loyalty program) relative to total bookings.
A higher ratio reduces reliance on third-party OTAs, lowers the commission costs that erode net revenue, and keeps guest data within the hotel's own systems, where it can inform CRM and marketing decisions.
For revenue managers and CFOs, improving this ratio is one of the clearest levers available for margin improvement without needing to move the rate. 
Hotels that invest in loyalty programs, direct-booking incentives, and a strong brand presence typically see this ratio improve over time, and the compounding effect on profitability as OTA dependency decreases is considerable.
Asset Management

Various factors feed into the success of a hotel’s asset management, which in turn contributes to financial performance. A hotel's location, real estate value, and even furniture, fixtures, and equipment (FF&E) all play a part. In a nutshell, asset management aims to maximize the value of hotel property.
Overviews and detailed analyses of hotel businesses on the whole can yield useful information on the revenue generated by different asset categories: how much different room types bring in, how profitable the restaurant is, or how lucrative the spa area has become.
A combination of operational and property knowledge allows hotel asset managers to identify potential new streams of income. Assets can also be better leveraged by completing strategic refurbishment projects or considering acquisitions.
The metrics below bring a quantitative dimension to asset management, helping operators understand how individual revenue-generating components are performing relative to their inventory and to the broader competitive market.
Market Penetration Index (MPI)
MPI measures a hotel's occupancy performance relative to its competitive set, indicating how effectively it is capturing its share of available market demand.
A result above 100 signals that the hotel is winning more than its fair share of occupied rooms compared to competitors in the same market; a result below 100 points to underperformance.
It is calculated by dividing the hotel's occupancy rate by the market occupancy rate and multiplying by 100, making it a straightforward but powerful benchmarking instrument for revenue and asset managers alike.

MPI is most informative when tracked alongside ARI, since a strong occupancy share achieved through aggressive discounting will show up as a high MPI paired with a weak ARI, which is a combination that signals volume at the expense of rate, rather than genuine market strength.
Revenue Generation Index (RGI)
RGI compares a hotel's RevPAR directly to the average RevPAR of its competitive set, making it one of the clearest benchmarks for understanding relative revenue performance in a given market.
A result of 1 or above indicates the hotel is generating at least its fair share of market revenue; anything below 1 signals that competitors are outperforming it on this combined measure of rate and occupancy. For asset managers and ownership groups, RGI provides a market-referenced view of performance that internal metrics alone cannot deliver.
Sustained RGI underperformance is typically a prompt for deeper investigation—whether into pricing strategy, distribution mix, product quality, or brand positioning—since it indicates that the asset is not competing as effectively as the market conditions available to it should allow.
Average Rate Index (ARI)
ARI completes the benchmarking trio by comparing a hotel's ADR directly to the average ADR of its competitive set. A score above 1 indicates stronger rate performance than the market; below 1 signals weaker pricing power relative to comparable properties.
When read in conjunction with MPI, ARI tells a more complete story: a hotel with both metrics above 1 is outperforming the market on both occupancy and rate simultaneously, which represents the strongest possible competitive position from a revenue standpoint.

If ARI is high but MPI is low, pricing may be too aggressive and suppressing demand. If MPI is high but ARI is low, the hotel is filling rooms but leaving rate on the table. The relationship between the two is where the most actionable asset management insight tends to live.
RevPAR Room Type Index (ReRTI)
ReRTI is a more granular metric that assesses whether individual room types are contributing to overall RevPAR in proportion to their share of total inventory.
A score above 1 for a given room type means it is generating a disproportionately high share of RevPAR relative to how many of those rooms exist in the property; a score below 1 indicates underperformance relative to inventory weight.
This makes ReRTI particularly useful for asset managers evaluating room mix decisions, refurbishment priorities, and the revenue impact of upgrade or upsell policies. 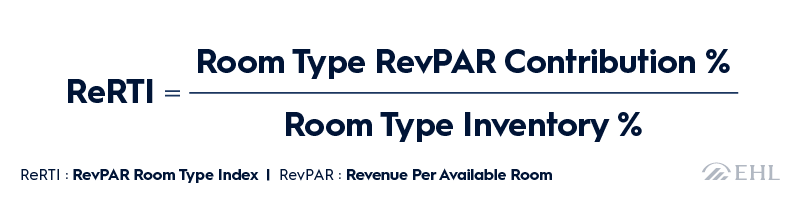
For hotels considering renovations or room category repositioning, ReRTI provides an evidence base for where investment is most likely to generate proportional revenue uplift and where current room classifications may be suppressing yield relative to their physical potential.
Service Excellence

As the preceding three dimensions make clear, performance remains well characterized by certain traditional criteria. To be clear, the wheel does not need reinventing when it comes to evaluating. It requires a few more spokes to round off and contextualize any insights gained from metrics alone.
No other dimension better exemplifies this more holistic approach than service excellence, defined as the ability of service providers to consistently meet and occasionally even exceed customers' expectations.
This strong orientation towards guest satisfaction relies on various efforts and strategies: reliably delivering on promises, providing genuinely personal service, and proactively managing customer feedback rather than responding to it after the fact.
Providing service excellence is a challenge in any context, and doing so consistently enough that guests seek out a property for that reason specifically requires a comprehensive service culture, the kind embodied by the Ritz-Carlton, where service standards are institutional rather than incidental.
Success in service excellence keeps guests returning and the positive reviews accumulating, to the point where there is a credible argument that it has become the most effective form of hotel marketing available.
Net Promoter Score (NPS)
NPS measures guest loyalty by asking a single question: how likely is a guest to recommend the hotel to someone else? Responses are classified into promoters, passives, and detractors, and the final score is calculated by subtracting the percentage of detractors from the percentage of promoters.
While it is not a financial metric in the traditional sense, NPS correlates directly with long-term revenue potential. Guests who actively recommend a property reduce acquisition costs, while detractors represent both lost repeat business and reputational risk that is difficult to quantify but very real in its effect.

For leadership teams, NPS provides a single trackable number that connects service investment to measurable guest sentiment over time, making it easier to evaluate whether operational or training initiatives are producing tangible improvements in how guests experience the property.
Customer Satisfaction Score (CSAT)
Where NPS captures loyalty and advocacy, CSAT measures satisfaction with a specific interaction or stay. Guests are typically asked to rate their experience on a numerical scale, and the aggregate score provides a department-level or touchpoint-level view of service performance that NPS alone cannot offer.
A hotel might carry a respectable NPS while masking specific service failures (a slow check-in process, inconsistent housekeeping standards, or underwhelming F&B quality) that CSAT data would surface directly.

Tracking CSAT alongside NPS gives management both a macro view of guest loyalty and a granular view of where the guest experience is strong or falling short, creating a more complete picture of service performance across the property.
Guest Lifetime Value (CLV)
CLV estimates the total revenue a hotel can expect from a guest across the entire duration of their relationship with the property. It is calculated by multiplying the average revenue per stay by the expected number of repeat visits and the average length of that guest's relationship.
As a metric, CLV reframes the conversation around guest acquisition and retention, shifting focus from the cost of a single booking to the long-term value of building genuine loyalty, which has direct implications for how hotels allocate marketing spend and design loyalty programs.

High-CLV guest segments justify deeper investment in personalization, loyalty benefits, and proactive service recovery, since the return on retaining a valuable repeat guest substantially outweighs the cost of acquiring a new one through third-party channels.
Online Review Scores
Online review scores aggregate guest sentiment across platforms such as TripAdvisor, Google Reviews, and OTA review systems into ratings that directly influence booking decisions.
Unlike internal satisfaction surveys, these scores are publicly visible and carry significant weight in how prospective guests evaluate a property before they ever interact with it directly.
A sustained pattern of strong reviews functions as organic marketing; a cluster of negative feedback around specific service failures can suppress demand in ways that take considerable time and effort to reverse.
Monitoring review scores consistently, and analyzing the qualitative content behind the ratings rather than the numbers alone, allows management to identify recurring service gaps, respond to guest concerns visibly and constructively, and track whether operational changes are producing improvements in public perception over time.
Innovation
Innovation in the hotel environment can be found in review processes, by consulting consumer trends and employing fitting IT systems, for instance. The Hospitality Innovation Industry Report distinguishes between technological and non-technological innovation. Here are some examples.
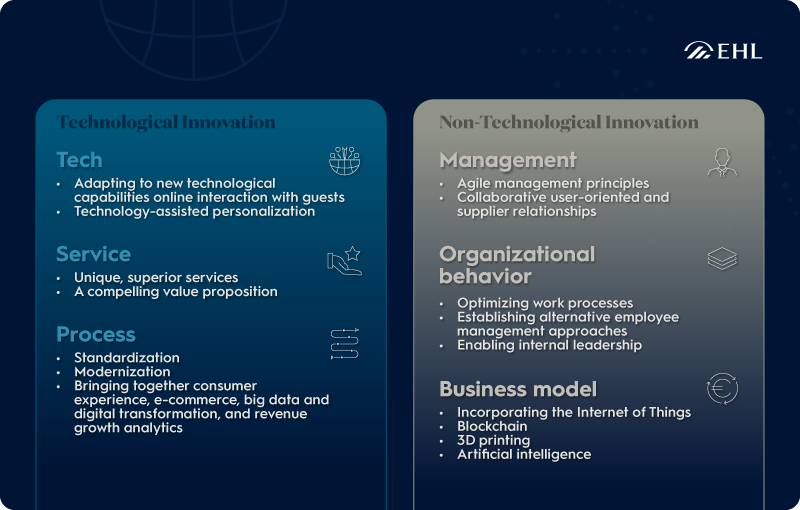
Current innovation trends in the hospitality industry include sustainable tourism, voice search, and the instrumentalization of big data. The ever-expanding list includes facial recognition check-in and mobile room keys.
A hotel's ability to keep up with the times simply must feature among contemporary X-factors, while recognizing disruptive innovation ahead of time can set hotels apart.
Health and Safety
When you think "health and safety", think risk analysis, quality labels, and safety procedures. It has always been important for hotels, as employers, to keep a close eye on workplace health and safety.
Guests, too, want to spend their time in a clean, hygienic, safe environment. Meeting food safety standards is crucial for any hotel restaurant, and your legal team will thank you for staving off any potential lawsuits arising from safety-related liability issues.
Major hotel brands including Hilton, Four Seasons, and Accor have made it their mission to instill confidence in their customers by implementing strict hygiene protocols.
Beyond the visible cleanliness and procedural standards that guests encounter directly, robust health and safety management also protects staff, limits operational risk, and underpins the kind of consistent service delivery that the preceding dimensions depend on.
Safety Audit Scores
Safety audit scores are derived from structured internal inspections that assess how closely a hotel's operations align with predefined health, safety, and hygiene standards across areas including food handling, fire safety, pool safety, and general workplace risk.
Conducted regularly and scored consistently, these audits provide management with an objective, trackable measure of compliance performance over time rather than a snapshot taken only when an incident has already occurred. A high and improving audit score indicates that safety culture is embedded in daily operations rather than applied selectively.
Audit completion rates matter as much as the scores themselves. A hotel that schedules safety inspections but routinely fails to complete them on time is carrying unquantified risk, regardless of how well individual audits score when they do take place.
Incident Reporting Rate
Incident reporting rate tracks the frequency of reported safety events (accidents, injuries, near misses, and identified hazards) across the property over a given period.
A common misconception is that a high reporting rate signals poor safety performance; in practice, a healthy reporting rate reflects strong safety awareness and a staff culture that treats transparency as a professional obligation rather than a liability.
Properties where incidents go unreported consistently look safe on paper, but they've obviously been operating without the data needed to identify and address risks before they escalate.
Tracking incident reporting rates alongside audit scores gives management a dual-lens view of health and safety performance: one that captures both the proactive standards the hotel holds itself to and the real-world events that test whether those standards are functioning as intended.
FAQs
Evaluating hotel performance involves much more than tracking revenue figures. As guest expectations evolve and operating conditions become more complex, hospitality leaders need broader ways to measure success.
The following questions explore how performance is assessed across operations, guest experience, financial health, and long-term competitiveness, helping provide additional context beyond the main themes covered in the article.
What is the most important KPI for measuring hotel performance?
There is no single KPI that fully captures hotel performance because hotels operate across multiple areas at once. Metrics such as occupancy rate, ADR (Average Daily Rate), and RevPAR (Revenue Per Available Room) remain essential because they provide insight into revenue generation and pricing effectiveness.
However, relying on one metric can create blind spots. A hotel may achieve strong occupancy through heavy discounting, for example, while weakening profitability. The most effective evaluations combine financial, operational, and guest satisfaction indicators to provide a more balanced understanding of performance.
How often should hotel performance be reviewed?
Most hotels monitor core performance indicators daily, particularly occupancy, room revenue, cancellations, and booking pace. However, meaningful evaluation requires multiple review periods. Weekly reviews help identify short-term trends, while monthly and quarterly assessments provide stronger insight into profitability, staffing efficiency, and market positioning.
Annual reviews are useful for measuring strategic progress and investment outcomes. Reviewing performance at different intervals allows managers to identify immediate operational issues while also tracking longer-term business objectives that may take months or years to materialize.
Why is guest satisfaction important when evaluating hotel success?
Financial performance can show whether a hotel is generating revenue, but guest satisfaction often determines whether that success is sustainable. Positive guest experiences contribute to repeat bookings, stronger online reviews, and increased brand loyalty. Dissatisfied guests may reduce future demand even when current revenue appears healthy.
Guest satisfaction data also helps identify operational weaknesses that financial reports may not reveal. By examining both customer feedback and business performance together, hotel operators can make more informed decisions that support long-term growth rather than short-term gains alone.
How do hotels benchmark performance against competitors?
Hotels commonly compare their results against competitive sets made up of similar properties within the same market. This benchmarking process helps operators understand whether changes in performance are driven by internal decisions or broader market conditions. Metrics such as occupancy, ADR, RevPAR, and market share are often analyzed against competitor averages.
Benchmarking can also extend beyond revenue metrics to include guest reviews, service quality ratings, and digital reputation. Comparing performance externally provides context that internal reporting alone cannot always deliver.
Can a hotel perform well financially but still have operational problems?
Yes. Strong financial results do not always indicate operational excellence. A hotel may benefit from favorable market conditions, seasonal demand, or limited local competition while still experiencing issues such as staff turnover, inconsistent service standards, or declining guest satisfaction.
These problems may not immediately appear in revenue reports but can gradually affect reputation and future performance. Evaluating operations alongside financial outcomes helps managers identify vulnerabilities before they become larger business challenges, making performance measurement more comprehensive and actionable.
Hotel KPIs: The Complete Picture

Evaluating performance in financial terms alone has never told the full story, and the expanding toolkit of metrics available to today's hoteliers only reinforces that point.
The 6 dimensions covered here: finance, sales performance, asset management, service excellence, innovation, and health and safety. Together, they provide a framework that is broad enough to capture the real drivers of a hotel's success and specific enough to act on.
Should you need a little help appraising where you stand, EHL Advisory Services' pulse-taker will point you in the right direction.